(174567) Varda = 2003 MW12 Precovery Images
(174567) Varda = 2003 MW12 Precovery Images
The original elements for 2003 MW12 were already quite accurate (5 oppositions from 2002 to 2007), so the identification of additional
images from DSS was straightforward. Eventually, 2003 MW12 was found on nine plates at seven oppositions going back to 1980.
The following astrometry was submitted to the Minor Planet Center:
     K03M12W   1980 03 19.68447 14 50 38.47 -02 28 38.7                      260
     K03M12W   1983 05 06.58984 14 59 30.58 -02 10 42.5                      260
     K03M12W   1984 07 18.43762 14 59 49.17 -02 04 07.4                      260
     K03M12W   1989 07 26.39593 15 18 55.21 -02 06 21.3                      260
     K03M12W   1992 05 30.54075 15 33 09.73 -02 05 13.3                      260
     K03M12W   1992 06 05.54100 15 32 46.93 -02 04 15.8                      260
     K03M12W   1993 03 31.69936 15 40 47.13 -02 25 50.4                      260
     K03M12W   1993 06 15.23576 15 36 12.32 -02 03 12.8                      261
     K03M12W   1994 03 10.48438 15 45 25.33 -02 35 11.1                      261
At the end of this page are the elements and residuals before and with the new data. The new orbit was much more accurate because the object
had now been observed for 27 years instead of five years, and consequently 2003 MW12 was numbered in January of 2008.
View the Discovery Announcement .
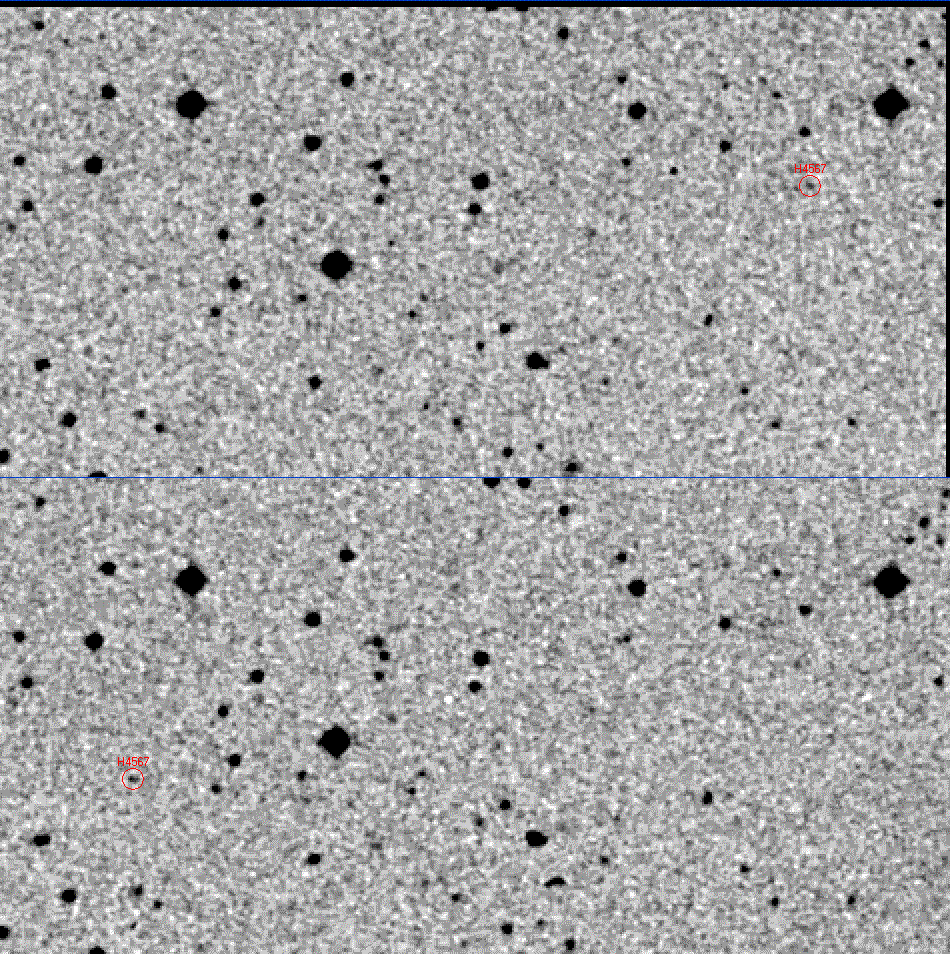
The two images from 1992 were taken only
six days apart, and this animation shows
the motion during that interval. The image
of (174567) 2003 MW12 from May 30 is on
the left, while the image from June 5 is on
the right. The display is 8' x 4' in size.
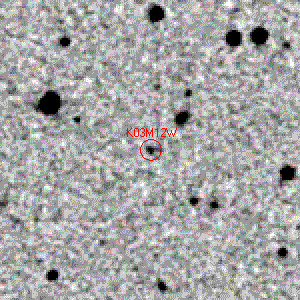
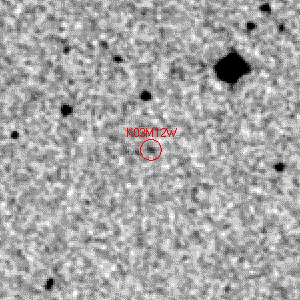
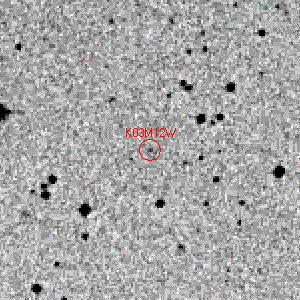
1994 Mar. 10.48438 UTC RA 15h45m25.33s Dec. -02°35'11.1"
55-minute exposure
Size = 150" x 150"
Palomar Mountain-DSS plate XJ870-A0TN
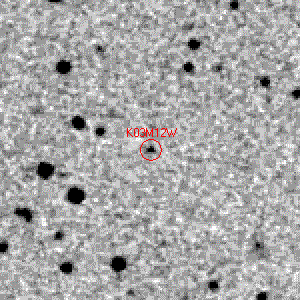
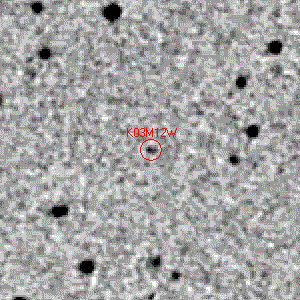
1993 June 15.23576 UTC RA 15h36m12.32s Dec. -02°03'12.8"
95-minute exposure
Size = 150" x 150"
Palomar Mountain-DSS plate XP870-A0TG
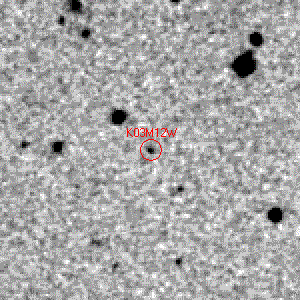
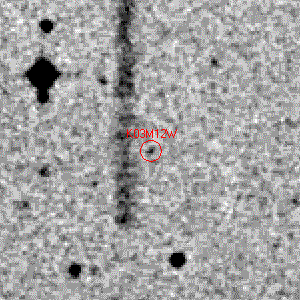
1993 Mar. 31.69936 UTC RA 15h40m47.13s Dec. -02°25'50.4"
65-minute exposure
Size = 150" x 150"
Siding Spring Observatory-DSS plate ER798-A2PC
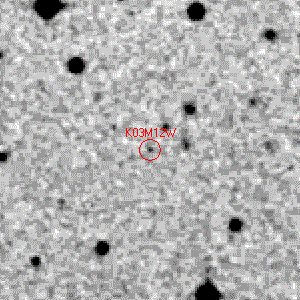
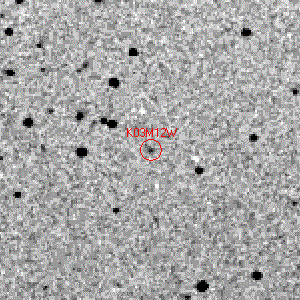
1992 June 05.54100 UTC RA 15h32m46.93s Dec. -02°04'15.8"
60-minute exposure
Size = 150" x 150"
Siding Spring Observatory-DSS plate ER870-A2BK
1992 May 30.54075 UTC RA 15h33m09.73s Dec. -02°05'13.3"
60-minute exposure
Size = 150" x 150"
Siding Spring Observatory-DSS plate ER869-A2BJ
1989 July 26.39593 UTC RA 15h18m55.21s Dec. -02°06'21.3"
75-minute exposure
Size = 150" x 150"
Siding Spring Observatory-DSS plate ER797-A0K1
1984 July 18.43762 UTC RA 14h59m49.17s Dec. -02°04'07.4"
60-minute exposure
Size = 150" x 150"
Siding Spring Observatory-DSS plate ER796-A0K8
1983 May 06.58984 UTC RA 14h59m30.58s Dec. -02°10'42.5"
60-minute exposure
Size = 255" x 255"
Siding Spring Observatory-DSS plate S796-02O5
1980 Mar. 19.68447 UTC RA 14h50m38.47s Dec. -02°28'38.7"
72.5-minute exposure
Size = 255" x 255"
Siding Spring Observatory-DSS plate S867-00WN
Original elements and residuals from the Minor Planet Center
2003 MW12
Epoch 2007 Oct. 27.0 TT = JDT 2454400.5                 MPC
M 259.60537              (2000.0)            P               Q
n   0.00315756     Peri.  180.94343     +0.99627112     -0.08228291             T = 2486195.52433 JDT
a  46.0152557      Node   184.05966     +0.08136513     +0.99608231             q =    39.5454658
e   0.1406010      Incl.   21.50269     +0.02869802     +0.03239691
P 312              H    3.6           G   0.15           U   4
From 41 observations at 5 oppositions, 2002-2007, mean residual 0".46.

Residuals
20020530  644  0.5-  0.1-    20030707  691  0.3-  0.2-    20060225  291  0.1+  0.1+
20020530  644  1.2-  0.0     20050504  691  0.7-  0.6+    20060225  291  0.2+  0.2+
20020530  644  0.8-  0.3+    20050504  691  0.7-  0.5+    20060227  291  0.0   0.2+
20020607  644  0.4-  0.2-    20050504  691  0.6-  0.7+    20060227  291  0.1-  0.3+
20030501  691  0.8+  1.3-    20050506  691  0.1-  0.2-    20060227  291  0.1+  0.4+
20030501  691  1.4+  0.9-    20050506  691  0.2+  0.2-    20070222  850 (0.2-  1.7-)
20030621  691  0.2-  0.0     20050506  691  0.0   0.2-    20070223  850  0.5-  0.6-
20030621  691  0.3-  0.5+    20050510  691  0.1-  0.3-    20070611  H01  0.5+  0.4-
20030621  691  0.2-  0.2+    20050510  691  0.2-  0.0     20070611  H01  0.4+  0.3-
20030628  691  0.1-  0.3+    20050510  691  0.1+  0.0     20070611  H01  0.5+  0.3-
20030628  691  0.4-  0.6+    20050514  691  0.4+  0.5-    20070611  H01  0.6+  0.5-
20030628  691  1.1+  0.1+    20050514  691  0.4+  0.1-    20070611  H01  0.4+  0.4-
20030707  691  0.1-  0.1-    20050514  691  0.5-  0.4-    20070614  688  0.4+  0.5-
20030707  691  0.0   0.5+    20060225  291  0.1-  0.1+    20070614  688  0.3+  0.5-
Revised elements and residuals from the Minor Planet Center
(new astrometry is shown in red)
(174567) 2003 MW12
Epoch 2007 Oct. 27.0 TT = JDT 2454400.5 MPC
M 259.75619 (2000.0) P Q
n 0.00315584 Peri. 180.81172 +0.99645919 -0.07997533 T = 2486165.08969 JDT
a 46.0320007 Node 184.05860 +0.07905814 +0.99626797 q = 39.5579191
e 0.1406431 Incl. 21.50251 +0.02861618 +0.03246645
P 312 H 3.6 G 0.15 U 2
From 49 observations at 12 oppositions, 1980-2007, mean residual 0".38.
Residuals
19800319 413 0.1+ 0.2+ 19830506 413 0.2+ 0.2- 19840718 413 0.0 0.5+ 19890726 413 0.0 0.3- 19920530 413 0.3- 0.4+ 19920605 413 0.1+ 0.7- 19930331 413 0.6- 0.0 19930615 675 0.3- 0.3- 19940310 675 0.2- 0.3-
DSS precovery images are from DSS plate archive scans, which are © copyright California Institute of Technology.
Back to TNO Precoveries
